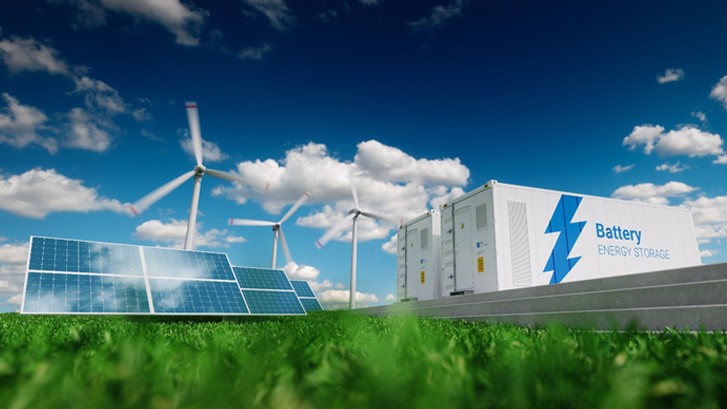
Enabling Affordable Decarbonization
Options for CO2 free electricity
Decarbonisation is urgently needed to prevent humanity from exceeding tipping points in the climate system[1]. The graph below [2] shows the worldwide primary energy consumption [in Exajoules] from 1995 to 2020. The financial crisis (2009) and the COVID pandemic (2020) both caused a temporary reduction, but in overall there is a clear upward trend in the worldwide need for energy.
If coal, natural gas and oil are to be phased out, the electricity production should be at least tripled. All of this electricity should be produced CO2 free. What options do we have to produce carbon-free electricity?
Natural gas, the benchmark
Baseload electricity today costs €60/MWh[3]. For a natural gas fired power plant this is split in €30/MWh fuel cost, €10/MWh CO2 tax and €20/MWh for everything else. We expect the CO2 tax to triple before 2030. This means baseload electricity price will increase to €80/MWh if natural gas fired powerplants remain the price-setting benchmark.
Hydro, tidal, geothermal: location limited
Hydro, tidal and geothermal power all have a role to play in the new energy system. They are carbon-free, but they all need the right location to work well. This limits their scalability.
Nuclear, proven but expensive
Nuclear power, although proven and CO2 free, isn’t cost competitive if the market price is €80/MWh. According to [4] the LCoE of nuclear is well above €100/MWh. Hinkley Point C, the UKs first new nuclear power plant for more than 20 years, could only be built with a guaranteed and inflation corrected electricity price of €108/MWh for the next 35 years.
CO2 capture, not a long-term solution
CO2 capture processes are about 85% efficient and cost €85/tCO2[5] . Energy need is 0.38 MWh/tCO2[6]. A natural gas fired plant produces 0.34 tCO2/MWh, so the power output of a NG plant should be increased by 13% to power its own CO2 capture process.
With the assumptions listed above the LCoE for a NG plant with CO2 capture will be €90/MWh. At 85% efficiency, and with the need to produce 13% more electricity, the CO2 emission is 17% of the plant without CO2 capture. So when the electricity production is tripled, the overall CO2 reduction is less than 50% compared to today. This will only delay, and not prevent, catastrophic climate change.
Why Wind-Solar-Storage will win the market
But the really big disadvantage of both nuclear power and CO2 storage is that in both cases society is left with a lot of dangerous waste, which obliges at least the next 5 generations to manage our waste for centuries to come. Nobody can say that this is a fair deal for our unborn offspring, and this is why we believe Wind-Solar-Storage systems will become the preferred technology for carbon-free electricity production.
But not at all costs… The next chapter describes the requirements for the most capital efficient Wind-Solar-Storage system possible.
Wind-Solar-Storage requirements
Not every combination of Wind-Solar-Storage is able to sell CO2 free electricity at €80/MWh. The three requirements are explained in the following paragraphs:
- The right ratio of solar to wind power
- The right combination of generation overbuild and storage duration
- The right type of storage
The right solar to wind ratio
For 1.5 GW of average power the combination of 2.25 GWp of (offshore) wind and 3.38 GWp of PV gives the smallest monthly or seasonal variation (in western Europe) according to our analysis (figure 2).
There will off course be year to year variation, but the above graph shows that there is no real need for seasonal storage if wind and solar power is installed at a managed ratio. Especially if there is some capacity overbuild (see next paragraph) it can be ensured that there is sufficient electricity generated in every month of the year.
Overbuild versus storage duration
Generation and storage capacity can be traded off against one another. A 99.98% reliable WSS system could be realized with a very large amount of solar and wind generating capacity, paired with a small battery energy storage capacity. Alternatively a relatively small amount of PV and wind generating capacity coupled to an extremely large battery capable of storing weeks of electricity demand would provide the same high level of reliability. A quantitative analysis gives a ‘Clean energy U-curve’[7], with the lowest cost system at the right combination of generation overbuild and storage duration. We’ve analysed this trade-off, using these key assumptions:
- Wind CAPEX: €1340/kWp
- PV CAPEX: €400/kWp
- 1.5 GWp wind + 2.25 GWp PV = 1 GW average power over 1 year for sunshine and wind resource availability, representative for The Netherlands
- Cost of 1x 1 GW overbuild = 2010 M€ for wind + 900 M€ for PV = 2,910 M€
- The first 10% of fluctuation can be met with demand response, so a 1 GW baseload WSS system needs 0.9 GW of battery peak power
- Flow Battery power domain CAPEX = €750/kW of nominal power, with 50% boost power this gives €500/kW of peak power.
- Flow Battery power domain CAPEX = €500/kWp x 0.9 GW = 450 M€
- Flow Battery energy domain CAPEX = €30/kWh. Calculation example: 0.9 GW – 100h = 2,700 M€ for the flow battery energy domain
With these assumptions we found the lowest capital expenditure with the combination of 50% overbuild and 100 hours of storage (figure 3).
For this wind-solar-storage system the CAPEX per 99.98% reliable kW is €7,200/kW. Obviously a wind-solar-storage system can also be build with Li-ion batteries. This is analyzed in figure 4. The same assumptions were used, apart from the power and energy domain CAPEX for the storage: €50/kW for Li-ion (vs. €500/kW for the flow battery) and €80/kWh for Li-ion (vs. €30/kWh for the flow battery) as shown in figure 4.
Also with the Lithium battery the ‘Clean energy U-curve’ can be seen. And also with Lithium the cost optimum is found with around 50% overbuild. However the CAPEX for the WSS system is >45% higher if Lithium based storage is used (note the different scales of the Y-axes in figures 3 and 4). With the Elestor storage system the WSS cost per 99.98% reliable kW is €7,200/kW. With the Lithium storage system however the cost per reliable kW is €10,600/kW.
In the next paragraph the CAPEX numbers will be ‘translated’ into LCoS numbers.
The right type of storage
If the storage ‘sweet spot’ is around 100 hours, it is important to know which battery technology has the lowest cost of storage for this duration of 100 hours.
We benchmarked the LCoS of 2026 upscaled Elestor systems against 2026 low-cost Lithium systems (€80/kWh) for varying storage durations using these key assumptions (table 1).
Levelized costs of storage, comparison to Lithium systems
The graph below shows the LCoS of our technology benchmarked against Lithium. At the relevant duration of 100 hours the Elestor LCoS is less than 50% of that of Lithium (figure 5).
The utilization is the percentage of the theoretical maximum annual throughput. The importance of utilization is explained in the next paragraph.
Effect of duration and utilization on LCoS
For the relative LCoS versus Lithium (see Fig. 4) the utilization is not a driver, however for the absolute LCoS it is. No long duration storage system is used at 100% of theoretical throughput, i.e. continuously charging or discharging at full power. So the LCoS shouldn’t be calculated on the basis of this 100% throughput which is never achieved in reality. In our wind-solar-storage system analysis we found that 30..35% utilization is realistic. Obviously the utilization will vary per application.
Storage duration also impacts the LCoS. A 5 hour system with 50% utilization has the exact same annual throughput as a 150 hour system with 50% utilization. Both spend a cumulative 3 months per year charging, 3 months per year discharging and 6 months per year doing neither of the two. However the CAPEX for the energy domain part of 150 hours system was 30 times higher, which obviously increases the LCoS.
So the LCoS isn’t a fixed number, the LCoS value for every storage system always decreases with utilization and it increases with duration. Shown below are the absolute LCoS values of Elestor (Fig. 6) and 2026 Lithium systems (fig. 7) versus utilization and duration.
Wind-Solar-Storage baseload at €80/MWh, can it be done?
For the combination of 35% utilization and 100 hours of storage the LCoS of Elestor is just over €200/MWh.cycle. This is much lower than Lithium (€450/MWh.cycle), but is it low enough to enable the desired €80/MWh baseload?
Baseload and surplus electricity, the link to green hydrogen
Suppose 1 GW of baseload electricity is sold at €80/MWh, this is (24 x 365) x €80,000/GWh = 700 M€ worth of electricity per year. In a WSS system with 50% overbuild actually 1.5 GW is generated on average. The electricity surplus will most likely be used for the production of green hydrogen. To generate 1 kilogram of hydrogen either 50 kWh of electricity or about €1 of natural gas is needed. So at €80/MWh electricity cost for electrolyzers green hydrogen can’t compete, but at <€20/MWh it can, provided that the electrolyzer (for green H2) or steam reformer (for ‘grey’ H2) have similar costs.
A detailed analysis of hydrogen production fuel cost is beyond the scope of this analysis. But we can safely assume that the surplus electricity has a value of at least 70 M€ (at €20/MWh), or 10% of the income generated with the baseload electricity.
Wind and PV LCoE
We expect that wind and PV energy will be generated in a 2:1 ratio, to minimize the seasonal influence (see Fig. 2). We expect the LCoE of offshore wind to be €37/MWh [8] by the end of this decade. The LCoE of PV varies with scale and location, but a LCoE of €30/MWh around 2026 is a conservative estimate when several PV plants are selling power already for <€15/MWh[9] in 2021. The costs to generate the electricity are €35/MWh on average with this 2:1 ratio for wind and PV. This is less than half of the €80/MWh baseload electricity value.
From LCoS to WSS system LCoE
If the utilization of the storage system is 35%, it is discharging 17.5% of the baseload electricity. This may seem like a small number, but makes the difference between suffering from lack of power during maximum 2 hours per year (with storage) or 1,500 hours per year (without storage).
If the LCoS is €200/MWh.cycle, the storage adds 0.175×200 = €35/MWh to the LCoE of baseload electricity in return for the huge increase in reliability. This is also less than half of the €80/MWh baseload electricity value. So a WSS system is cost competitive with a storage technology that has around €200/MWh.cyle LCoS if (A) the duration is 100 hours and (B) the utilization is 35%.
With the Elestor technology this is possible, and this is why Elestor is enabling affordable decarbonization!
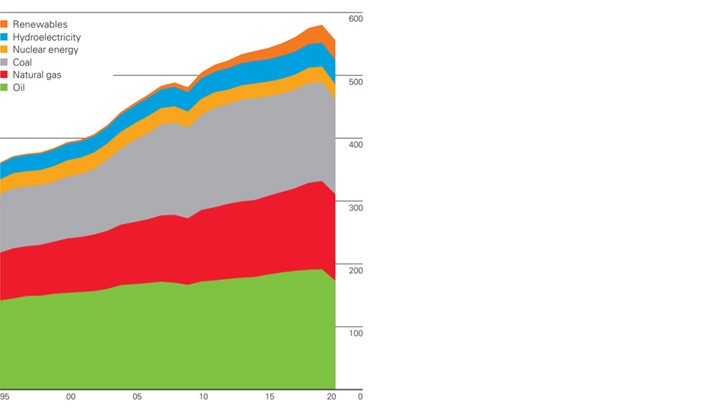
Figure 1 Worldwide primary energy consumption from 1995 to 2020 [Exajoules]

Figure 2 Monthly output of Offshore wind & PV system with a 1:1.5 ratio of Wind:PV peak power
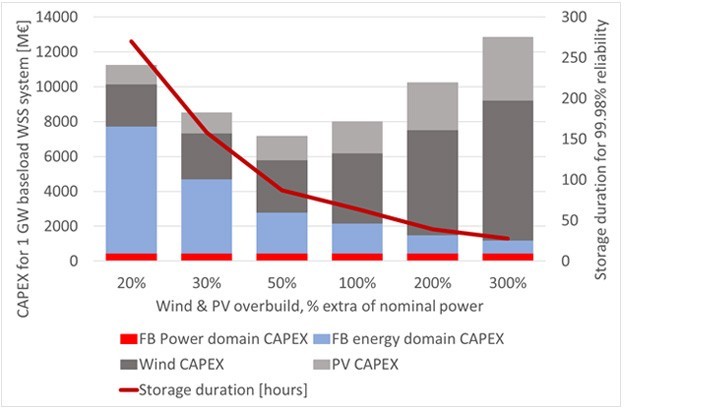
Figure 3 CAPEX of 99.98% reliable WSS systems with flow battery with varying overbuild and storage duration (left axis), required storage duration [hours] for varying overbuild ratios (right axis)
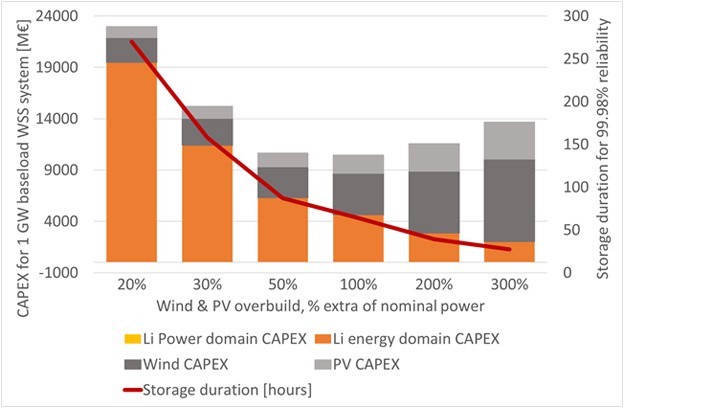
Figure 4 CAPEX of 99.98% reliable WSS systems with Lithium-ion battery with varying overbuild and storage duration (left axis), required storage duration [hours] for varying overbuild ratios (right axis)
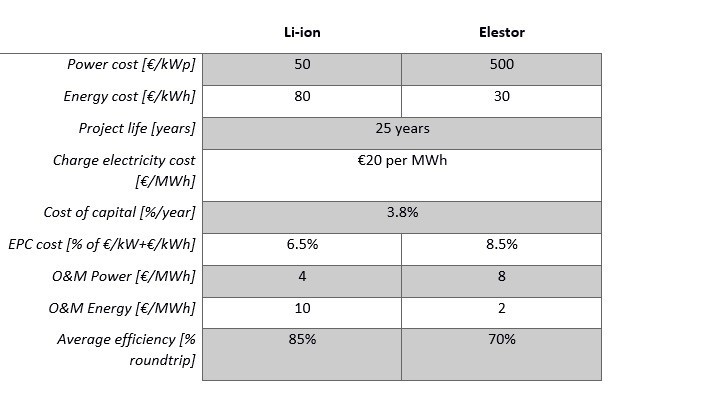
Table 1 Key assumptions for LCoS comparison 2026 Li-ion & Elestor
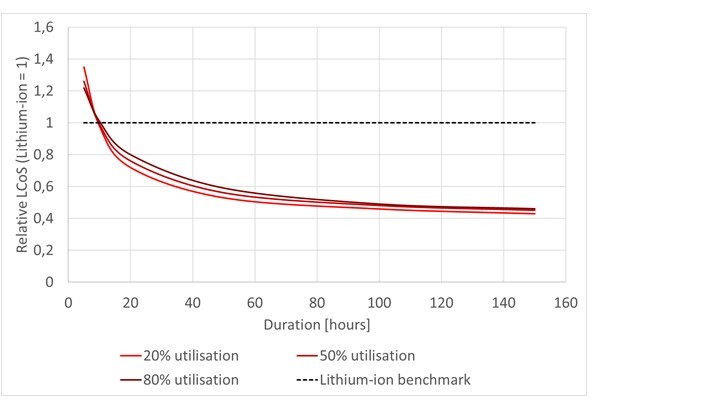
Figure 5 Relative LCoS of Elestor (Lithium-ion = 1) for 5 to 150 hour storage duration for 20, 50 and 80% utilization.
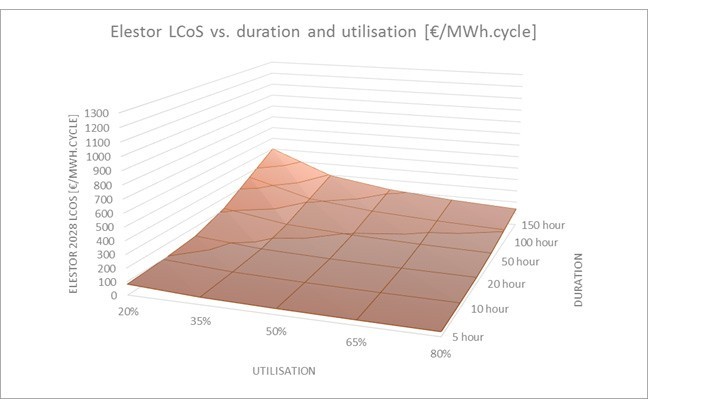
Figure 6 Elestor 2026 LCoS for varying utilization and duration
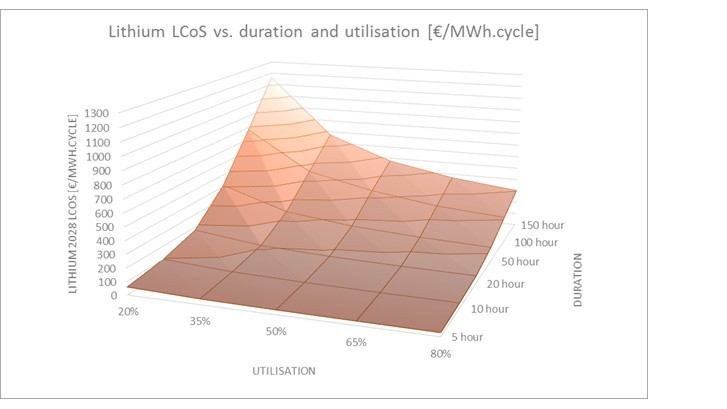
Figure 7 2026 Lithium-ion LCoS for varying utilization and duration

Elestor and Windpark Zeewolde partner on long-duration energy storage to address grid congestion
Elestor and Windpark Zeewolde have entered a collaboration for the phased deployment of a large-scale hydrogen-iron flow battery at the largest onshore wind farm in The Netherlands.
Read more
Dutch hydrogen battery promises 2 cents per kWh and lasts for decades
Article on TW.nl: A Dutch breakthrough in battery technology could keep the electricity grid stable for decades, at low cost and as a sustainable alternative to lithium batteries. This hydrogen–iron flow battery could significantly reshape large-scale energy storage.
Read more
Hydrogen-iron flow battery could deliver 25-year grid energy storage with 80% efficiency
Article on Interesting Engineering: A Dutch battery manufacturer has developed a revolutionary hydrogen-iron flow battery that could reportedly power grids for decades while maintaining stable efficiency across tens of thousands of charge-discharge cycles.
Read more